
October 17, 2019 | Engineering + Technology,
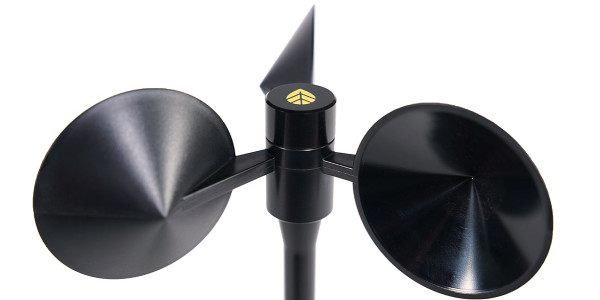
 With the introduction of the NRG S1 Anemometer in August 2019, NRG Systems conducted a round-robin S1 calibration study. The intent of the study was to quantify in a transparent way the differences in calibration results that NRG customers should expect from the three industry-leading wind tunnels that provide calibrations for NRG anemometers. The results showed a high degree of repeatability in the S1 anemometer response and a low degree of bias across the wind tunnels included in the test. The results of the study are presented below, prefaced by a brief introduction to anemometer calibration and some wind industry context.
Calibration
Traceable anemometer calibrations are a basic requirement of wind resource assessment and power performance testing campaigns and have been at least since their inclusion in Edition 1 of the IEC 64100-12-1 standard, published in 2005. The standard requires that all measuring equipment be calibrated to a traceable reference, and specifies wind tunnel requirements and a calibration procedure to follow. While the standard only strictly applies to power performance tests, the calibration guidance has become the default industry best practice in most wind energy markets for resource assessment as well. A second edition of the standard was published in 2017 and included updates to the section providing calibration guidance, Annex F.
MEASNET
The MEASNET network of companies consists of many of the world’s leading wind energy institutes and wind tunnel facilities, drawn together by the common goal of producing high quality, interchangeable measurement results. MEASNET standards and methods have become the de facto standard for precision and repeatability within the global wind energy industry, particularly with respect to cup anemometer calibrations.
NRG offers wind tunnel calibrations at three certified MEASNET facilities for each of the cup anemometers that we sell:
- SOH Wind Engineering (Williston, VT, USA)
- SOH Wind Engineering (Copenhagen, DK)
- Deutsche WindGuard (Varel, DE)
Further information about MEASNET and its membership is available on their website.
Previous Anemometer Calibration Round-Robin
In 2013, a working group of industry stakeholders formed to investigate how results vary across international wind tunnels commonly used for cup anemometer calibrations within the wind energy industry. NRG Systems participated in the study, alongside AWS Truepower (now UL), DNV GL, NREL, Pattern Energy, Siemens, SOH Wind Engineering and WSP, and presented findings from their research at the AWEA Wind Resource and Project Energy Assessment Seminar in September 2015.
The investigation’s main focus was a round-robin calibration study. Six different anemometer models – five cup anemometers and one propeller-based model – were calibrated at four different wind tunnels. The results showed no clear bias between anemometers and anemometer outputs within ±1% at 8 m/s wind speeds. There was also no clear bias found between the participating wind tunnels. The study also compared initial and final calibrations from the same tunnel and determined that the results were repeatable.
For more information on this round-robin study, including the presentation from the aforementioned AWEA event, please contact NRG or one of the other participating institutions.
S1 Calibration Round-Robin Results
NRG calibrated 33 S1 anemometers as part of the round-robin study. The sensors were first sent to SOH Wind Engineering in Williston, VT (SOH WE), then SOH Wind Engineering in Copenhagen, DK (SOH CPH), and then to the Deutsche WindGuard facility in Varel, DE (DWG). Finally, the sensors were returned to the initial tunnel, SOH WE, and calibrated once more to establish an intra-tunnel repeatability baseline (SOH WE RECAL).
Percent Deviation
Following the methodology precedent set by the 2015 industry round-robin, NRG quantified sensor-to-sensor variability by looking at the average percent deviation of the 33 sensors relative to 8 m/s at each of the tested tunnels. The results showed similarly low percent deviations at each facility and compared favorably against the analogous results from the earlier calibration study.
 Figure 1: Average % deviation of the 33 NRG S1 Anemometers relative to 8 m/s.
 Figure 2: Results presented at AWEA Wind Resource & Project Energy Assessment Seminar, September 16-17 2015, New Orleans, LA (USA).
80 Hz Response
Tunnel-to-tunnel variability was quantified by comparing the wind speed generated from an 80 Hz signal frequency using the average transfer function from the 33 calibration results at each wind tunnel. The largest deviation in result, between the DWG calibration and the SOH WE RECAL, returned a wind speed difference of 0.018 m/s at 80 Hz, 0.237% of the lesser value.

Figure 3: Average 80 Hz response as generated using the average transfer function from each wind tunnel.
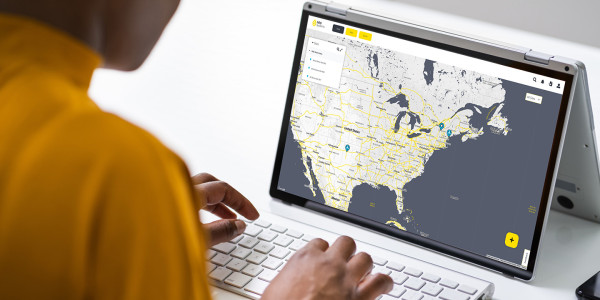
Calibration reports are available through the calibration report retriever tool on the NRG website. If you have questions about the S1 anemometer or the calibration study outlined in this blog, please feel free to contact me at rpc@nrgsystems.com.