
FAQs
Identifying icing events in wind data
Here are a few general guidelines regarding icing events:
- Typically, the vanes will freeze first. Both the average and standard deviation of an iced vane channel will read 0 before the average and standard deviation of an iced anemometer channel found at the same level on the tower will read 0. The time can be from a few hours to several hours ahead of the anemometer channel going to 0.
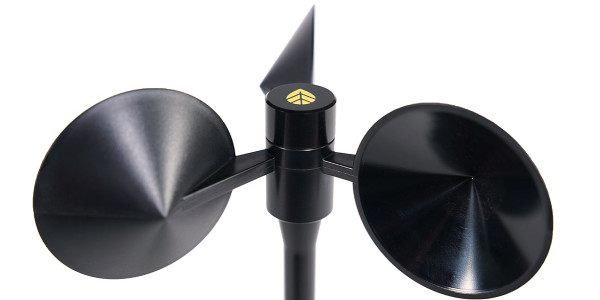
- For an anemometer, the standard deviation will slowly decrease to lower than normal levels over the course of many 10 minute intervals as the ice builds up on the cups. The additional mass of the ice makes the anemometer act more like a flywheel -responding more slowly to changes in wind speed. Hence, the lower standard deviation.
- After many 10 minute intervals of showing a decreasing standard deviation, the anemometer channel will often show a standard deviation "spike" in the 10 minute interval right before the anemometer stops spinning. That is, the standard deviation will rise sharply in one interval within a few 10 minute intervals of the anemometer stopping and then quickly go to 0.
- Check the temperature probe channel. Icing likes to happen in the temperature range right around the freezing point of 0 C (32 F).
Whenever possible, use an IceFree3 sensor.
Download Calibration Reports
Our Calibration Report Retriever Tool is a comprehensive database of reports for the following products:
NRG Anemometers
110S Temperature Sensor
200M Wind Vane
200P Wind Vane
BP20 Barometric Pressure Sensor
BP60 + BP60C Barometric Pressure Sensor
HybridMC Anemometer + Vane
HybridXT Anemometer + Vane
PVT1 PV Temperature Sensor
T60 + T60C Temperature Sensor
R1 Pyranometer
R2 Pyranometer
RH5X Relative Humidity Sensor
Thies First Class Advanced Anemometer
WindSensor P2546-OPR Anemometer
Tech Support
Whether you are troubleshooting in the field or learning how to install a product, we are here for you.